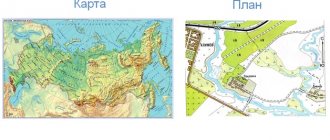
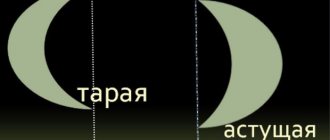
Site plan and map: differences
A geographic map is a reduced, generalized image of the Earth’s surface on a plane, constructed in one or another cartographic projection and scale (according to a mathematical law).
The differences between a plan and a map are as follows.
- The plan depicts small areas of the earth's surface: a village, a schoolyard, a street, etc. It can be compared to an aerial photograph, which also depicts a small area of the terrain taken from above. But unlike an aerial photograph, objects on the map are shown with symbols and have inscriptions. The plan is drawn on a large scale (1:5000 and larger) and compiled on the ground or from aerial photographs; the sphericity of the Earth is not taken into account. Maps depict much larger areas and on smaller scales. In this case, a variety of materials are used depending on the content of the map, including satellite images.
- All objects and details of the area are plotted on the plan at a given scale. Maps depict only the most significant objects that correspond to the content of the map (generalization).
- When drawing a plan, the curvature of the earth's surface is not taken into account due to its negligible value; it is assumed that the depicted areas are flat. All objects are shown as they really are, without distortion, their shape and outline are preserved, only their size is reduced in accordance with the scale. When constructing maps, the sphericity of the Earth must be taken into account, so distortion of objects on them is inevitable. Moreover, those objects whose display is necessary, but they do not appear on the scale of the map, are depicted with off-scale signs.
- There is no degree grid on the plans, but on the maps there are always parallels and meridians.
- On plans, the direction to the north is considered to be up, to the south is down, to the west is to the left, to the east is to the right. The north-south direction is additionally indicated by an arrow with captions. On maps, the north-south direction is determined by meridians, and the west-east direction by parallels. They can be not only straight lines, but also arcs of different curvature depending on the map projection.
Aerial photograph and terrain plan
Features of the terrain on the plan and map are displayed, indicating the relative and absolute heights of the object. Relative height is the difference in height of two points on the earth's surface.
Absolute height is the vertical distance in meters from a given point to sea level. In Russia, the absolute altitude is calculated from the zero gauge in Kronstadt (a port in the Leningrad region on Kotlin Island, the Baltic Sea). It can be positive (the area is above ocean level) and negative (the area is below ocean level). Most of the land has a positive absolute altitude. Examples of negative absolute height are less common on land: the Qattara Depression in Africa (-133 m), Death Valley in North America (-85 m).
Unevenness of the earth's surface, i.e. relief and water on maps are displayed in two ways: using contour lines [ isohypses (from the Greek hýpsos - height)] - show lines with the same absolute height and isobaths (from the Greek bathos - depth) - show lines of the same depth.
To determine absolute heights and depths, a scale of heights and depths is placed on physical maps. It should be noted that as the altitude increases from 0 m or more, the color of the surface on the physical map changes from light green (plains) to dark brown (high mountains). As depth increases, the color of the surface also changes from bluish (0 m) to dark blue (deepest depressions and troughs). Therefore, height or depth on a physical map is determined by the shade of color that is in the spectrum.
Relief image on the site plan
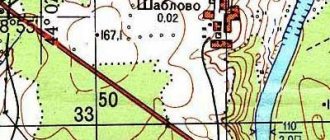
The difference between site plans and topographic maps
| Site plan | Topographic map | |
| Frames and scale | Scale from 1:5000 and larger, any frames, most often they use 40X40 or 50X50 | Scale from 1:200,000 to 1:10,000 (5000). The frames must comply with the requirements of the nomenclature of topographic maps. |
| Coordinates (degree network) | There is no degree network; it is not tied to geographic coordinates. The direction to the north is indicated by an up arrow or without an arrow; the top edge of the sheet on the plan is always north. Can be linked to plan coordinates, there is a kilometer grid. | There is both a kilometer and degree network; for any point you can find out the exact coordinates. They are used by the military for accurate shooting. |
| Level of detail | Most local landmarks are indicated, even individual trees. | Only those landmarks that can be considered durable (for example, buildings) are plotted on the map. |
| Degree of secrecy | Schemes of utility lines, military facilities, and land plots are available for official use only. Most of the site plans, due to their lack of attachment to coordinates, are not secret. | Until recently, all topographic maps were secret. Now they are being declassified, but the largest ones are being opened in parts. |
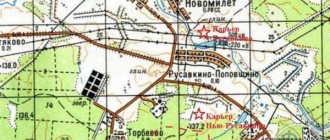
The difference between a site plan and a topographic map
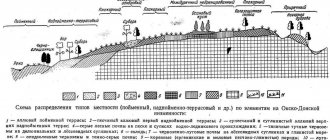
Methods for depicting irregularities of the earth's surface on a map or plan
Different parts of the Earth differ in their height. There are mountains, plains, hills, and depressions. There is a need to somehow mark on a map or plan the elevation level of a particular area.
The simplest method is to use so-called contour lines. A horizontal line is a line on a surface, all points of which have the same height. On the plan they are shown as a closed line, and the heights marked on the plan go with a certain step. For example, in this plan the step is 5 meters:
Hill image: https://www.yaklass.ru
The closer the horizontal lines are to each other, the more abruptly the height changes on the ground. That is, on steeper slopes the horizontal lines are located closer, and on flatter terrain they are farther apart.
For convenience, so-called berg strokes are placed at some horizontal lines. These are small lines coming from the horizontal lines. They show the direction in which the altitude is decreasing. With their help, it is convenient to evaluate whether a depression or a hill is reflected on the plan. The following picture shows the image of the depression using bergshades:
Image of the depression: https://www.yaklass.ru
It is not always convenient to use contour lines on maps, so height can be indicated on them using color. Plains at sea level are shown in green on these maps, and mountains are shown in brown. It is also convenient to display the depth of reservoirs. Shallow-water regions are shown in light blue, and deep-water regions are shown in darker shades:
Physical map of Eurasia: https://infourok.ru
Please note that in the lower left corner of the above map there is a special scale that shows which heights are colored in what color. This map shows that the highest altitudes are recorded in Tibet (large red spot in the center of the map). Indeed, the Himalaya mountain system is located there. Here you can see that the depths in the Arctic Ocean (at the very top of the map) are small, and the deepest areas are located on the right side of the map, on the borders of the Northwest Basin.
List of sources used
• https://interneturok.ru/lesson/geografy/5-klass/plan-i-karta/izobrazhenie-nerovnostey-zemnoy-poverhnosti-na-plane?konspekt • https://www.yaklass.ru/p/geografiya /5-klass/izobrazheniia-zemnoi-poverkhnosti-i-ikh-ispolzovanie-131512/sposoby-izobrazheniia-nerovnostei-zemnoi-poverkhnosti-154811/re-5a53e8e6-39bb-48a6-bbaf-da1efcd7e86d
Didn't you find everything? Use site search ↓
What types of terrain plans are there?
With the help of a plan, you can learn the simplest skills of making topographical surveys, moving in azimuth, and navigating the terrain. To draw up a plan of the area (in other words, to take a survey of the area) means to depict this territory on a drawing at a selected scale using symbols. To compile, we will need a tablet with a sheet of paper attached to it, a compass, a ruler, a measuring tape, a field compass or tape measure (optional), a pencil, and an eraser.
The plan can be drawn up using horizontal or topographic surveys of the area. Depending on this, plans are divided into:
- topographical - they show both the relative position of objects (situation) and landforms (solid horizontal lines). Compiled on the basis of vertical (leveling) or topographic survey, on a scale of 1:5000 and larger;
- contour (situational) - only the relative position of objects is shown here. Contour plans are built on the basis of plan, or horizontal (contour) photography.
To draw up a contour plan, the following methods of horizontal surveying of the area are used:
Polar eye survey of the area
- polar (polar directions, polar coordinates);
- azimuthal;
- serifs (bipolar coordinates);
- perpendiculars (rectangular coordinates, ordinates);
- measurements (sections);
- bypass (route).
All methods are based on the rules of geometry and provide results for determining the relative positions of points on the earth's surface.
Image of elevation marks on the map
Relief is depicted on topographic maps using contour lines - closed curved lines of equal height above sea level.
Definition 1
Horizontal is a line of equal absolute heights of the earth's surface.
The drawing and relative position of the horizontals shows the relative position, relationship and shape of the irregularities of the depicted surface. Horizontals have the following characteristics: section height and laying.
Definition 2
The height of the section of horizontal lines is the distance (in height) between adjacent cutting surfaces.
The height of the section is determined by the nature of the terrain and the scale of the map. This characteristic is indicated on each sheet of the map in text form under the frame on the south side.
Are you an expert in this subject area? We invite you to become the author of the Directory Working Conditions
Definition 3
The location of contour lines is the distance on the map between two adjacent contour lines, depending on the height of the relief section on a given map and the steepness of the slope. The distance between adjacent contour lines on the map.
This characteristic clearly shows the steepness of the slope: the shallower the slope, the greater the angle of inclination.
How to make a site plan based on polar photography?
This method of shooting is used to plan open spaces limited by curved contours.
- We fix a sheet of checkered paper on plywood or a tablet. We fix the compass in the upper left corner, orienting the letter C (North) up (towards the top edge of the sheet).
- We select a point (pole) - the place from which we will film the area. The panorama is best viewed from an elevated position. The point should be in the center of the area being photographed, from where it is clearly visible. That is why such terrain survey is called polar - it is carried out from one point.
- Select the scale of the plan. We measure the distance on the ground that we will need to put on the sheet. Let it be maximum 300 m. Let’s measure our sheet - 10 cm x 10 cm? To choose the right scale, divide 300 by 10, we get 30. Our scale is 1 cm 30 m. We sign the scale at the bottom of a sheet of paper and draw a linear scale.
- We orient the tablet to the north, draw an upward arrow in the upper corner of the plan and sign north-south. When working, we constantly make sure that the compass needle points north. After orientation, we put a point on a sheet of paper, indicating the place from where we will shoot (we chose it at the beginning).
- We make a sighting on the main landmarks using a sighting ruler - we determine the direction and draw a thin line with a pencil on paper.
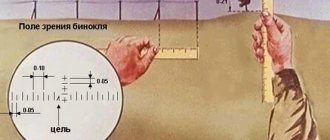
- We determine and sign the azimuths for these objects (the angles between the direction to the north and the object, measured clockwise) and plot the distance to them. How? First, we measure them on the ground - with a tape measure, field compass or steps, take the average step length of 60 cm. To calculate the distance, first multiply the number of steps by 60, let our distance be 10 steps, then we get 600 cm or 6 m. We transfer the distance to the plan, for this we divide 600 by the scale value: 600:30 = 20 cm (something turned out to be greater than the length and width of our sheet). We designate them (landmarks and objects) using conventional signs. The distance to an object whose height is known is easily determined. To do this, holding a pencil vertically in an outstretched hand, mark a segment on it that covers the observed object, and then this segment is measured. The required distance (S) is determined from the similarity of two triangles.
In order not to confuse where the azimuths are labeled and where the distances are, azimuths can be indicated by degrees, and distances in steps or meters.
Outlines of polar and route surveys
- After all the work completed, we received the so-called outline, but this is not a finished plan yet. The plan is drawn up in office conditions. On a blank sheet of paper, sign the scale again and draw a north-south arrow. Using a ruler and a protractor, transfer the entire drawing to this sheet at the selected scale. At the end of the work, draw a frame and sign the name of the plan inside it.
- On the plan itself, the names of objects are signed and designated by symbols. At the bottom of the sheet they write a legend of the plan - symbols with interpretation. There we already have a scale designation, and we also put the author’s initials there.
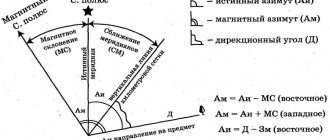
Determination of azimuths on the ground
Types of contours
There are the following types of contour lines on the map:
- basic or solid. They are drawn in solid lines in accordance with the established section height;
- half horizontals , or semi-horizontals, which are drawn in broken lines through $½$ of a selected section height and serve to display important details.
- auxiliary contours , which show even more subtle features of the relief and are applied approximately ¼ of the height of the section with broken lines with short links
- thickened horizontals are the main horizontals that correspond to five times the height of the section. In accordance with the name, they are drawn thicker and used for easier reading of cards.
Finished works on a similar topic
Coursework Image of relief on a map 450 ₽ Abstract Image of relief on a map 260 ₽ Test work Image of relief on a map 190 ₽
Receive completed work or specialist advice on your educational project Find out the cost
Example 1
If at the bottom of the map there is the inscription “Solid contour lines are drawn through $100$ m,” this means that thin solid lines—solid contour lines—are drawn every $100$ m, and thick contour lines are drawn every $500$ m.
Shooting using the perpendicular method
Using the perpendicular method, you can draw objects located close to the road or to a conditional parallel line. This way you can map a section of the river. The most prominent sections of the river are recorded using perpendicular lines. The shooting takes place in the process of passing the area with stops at selected points and sighting and measuring areas of the terrain in them.
From the selected point 1, on a previously oriented tablet on paper, draw perpendiculars to nearby objects and mark the distance on the lines. Measure the distance to point 2 and carry out the same work there. This method differs from route photography only in that only objects located at right angles to the point of information collection are marked.
Route (contour) shooting
It is carried out along the line of a road, river, edge of a forest, along the shore of a lake and other more or less rectangular areas. The path is divided into points, between which distances are measured, and from each point azimuths are determined and distances to reference objects are calculated. In this case, the shooting is done in a mixed way. Order:
- at each point the tablet is oriented to the north;
- using polar photography or the method of perpendiculars, the main objects are plotted on the plan, then a line is drawn to the next point;
- measure the distance between points and plot it to scale on the plan;
- shooting from the second point.