A topographic map contains complete information about the relief , the location of rivers and lakes, soils and vegetation.
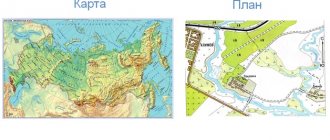
The plan is a large-scale drawing showing a small area of land with symbols .
It maintains a constant scale in all directions and is built taking into account the curvature of surface levels.
At its core, the plan retains the properties of the map and is its integral part.
Topographic map concept
A topographic map is an image of an area at many times reduced scales.
They note:
- main points of geodesy or geology;
- relief features;
- hydrographic information;
- borders, roads;
- communications;
- important objects.
A topographic map is a way to display an area on paper for further orientation.
Topography deals with the study and compilation of images of geographical objects, based on survey materials from the air or from space. The main product of topography compiled by specialists is topographic maps. Topography controls the content of maps, the description of the rules for their compilation, as well as the introduction of additional changes over time.
The main methods used to compile maps:
- ground survey using geodetic devices;
- aerial photography;
- satellite imagery.
Modern methods of processing obtained images make it possible to make topographic maps as accurate as possible, close to reality. For this purpose, graphic processing is used, as well as the implementation of special computer programs.
The basic rule of mapping involves following a clear template, with detailed instructions regarding design style and scaling.
Areas of application of topographic maps:
- necessary in the military departments for planning strategic exercises in army units;
- used in construction for carrying out geodetic or geological work, as well as in the construction and planning of road surfaces;
- are used in agriculture in calculations regarding the placement of plantings and planning their care.
A topographic map is an item that is necessary during search and rescue operations, and is therefore often in demand by employees of the Ministry of Emergency Situations.
Purpose of topographic maps.
Topographic maps serve as the main source of information about the area and are used to study it, determine distances and areas, directional angles, coordinates of various objects and solve other measurement problems. They are widely used in troop command and control, and also as a basis for combat graphic documents and special maps.
Topographic maps (mainly maps at scales 1:100,000 and 1:200,000) serve as the main means of orientation on the march and in battle. The 1:25,000 scale map is intended for a detailed study of individual areas of the terrain (when crossing water barriers, landing and in other cases), making accurate measurements, as well as for calculations during the construction of military engineering structures and military facilities.
Maps of scales 1:50,000 and 1:100,000 are intended for a detailed study of the terrain and assessment of its tactical properties when planning and preparing combat operations, command and control of troops in battle, target designation and orientation on the battlefield, determining the coordinates of firing (starting) positions, reconnaissance means , goals and performing the necessary measurements and calculations.
A 1:200,000 scale map is intended for studying and assessing the terrain when planning and preparing combat operations of all types of troops, commanding troops in an operation (battle), planning the movement of troops and navigating the terrain during a march.
Maps of scales 1:500,000 and 1:1,000,000 are intended for studying and assessing the general nature of the terrain during preparation and conduct of operations, and are also used by aviation as flight maps.
Classification of topographic maps
In each application area, a certain class of cards is used. As a rule, maps are classified according to two criteria: by scale and by main purpose.
Experts classify types of cards into separate classes:
- Overview . Includes engineering research materials that represent large areas of the globe. Most often, such maps are used to study geography, as well as scientific and reference material. They are convenient as a basis for studying and comparing several regions, and are also suitable in cases where high accuracy is not a priority.
- Military-strategic. These are materials that are often classified. The compilation of images is carried out by the discipline of military affairs - military topography.
- Land management . These are images created from engineering notes using specific data obtained from surveying or geological work.
Pilot cards.
Designed for driving ships and designing hydraulic structures on rivers. The approximate scales of the maps and the height of the isobath section are indicated in the table. Pilot charts contain detailed information about the coastline, depths, underwater obstacles, and navigational marks.
Depths are shown with isobaths and marks. Depths are calculated from the water level at low water. The pilot's chart is used together with the river navigation chart.
Based on materials from the book Handbook of Military Topography. A. M. Govorukhin, A. M. Kuprin, A. N. Kovalenko, M. V. Gamezo.
Classification by scale
A topographic map is a product of topography in which variation in dimensions is of great importance.
This principle underlies the classification of topographic maps by scale:
- Small-scale . Images in proportion 1:200000 or 1:1000000. They are necessary for studying a specific territory, during planning activities related to the development of the national economy, as well as during the construction of industrial structures. In addition, small-scale maps are used to calculate useful resources and water space.
- Medium-scale . These are intermediate type cards with proportions 1:250000, 1:50000, 1:100000. Site plans using these scales are highly accurate. Such maps are widely used in the national economy, for military purposes, for various calculations, as well as for planning geodetic or prospecting work.
- Large scale . Maps with aspect ratios 1:5000 and 1:10000. They are necessary when conducting exploration by geologists and when planning the construction of industrial and transport facilities. Large-scale maps are used by the military for tactical and strategic purposes.
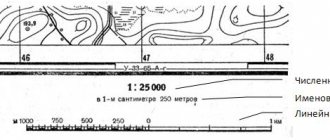
Scale is indicated on maps in different ways:
- Numerical . The notation looks like a fraction with a numerator equal to one and a denominator equal to the degree of reduction. It is used as an explanation and written on one of the frames of the card. The numerical scale indicator is equal to the value that corresponds to 1 cm.
- Linear . The explanation looks like a ruler divided into equal sections. A linear scale is necessary for those specialists who, while studying a topographic map, measure distances and convert them into natural values.
The scale of the map is directly related to the amount of detail that the cartographic image has.
The map scale used for cartographic images is established by a single order of the Ministry responsible for the economic development of the country.
The scaling order is clearly regulated by the rules, so the error of cartographic images is minimized.
Classification and purpose of topographic maps, city plans and special maps.
On general geographical maps, all the main elements of the area are depicted with completeness, depending on the scale of the map, without specially highlighting any of them. On special (thematic) maps, some elements of the terrain are displayed in greater detail or special data is plotted that is not shown on general geographic maps. Special maps include historical, economic, political-administrative, hydrological, geological, road and others.
Topographic maps are general geographic maps at scales of 1:1,000,000 and larger, depicting the terrain in detail. They are published in separate sheets of certain sizes and established scales.
The dimensions of a map sheet in kilometers mean: the first number is the extent from north to south, this size is almost constant for any latitude. The second number is the extent from east to west; this size gradually decreases with increasing latitude. For maps of scales 1:25,000 - 1:200,000, the sides of the frame range from 36.86 cm at the equator to 37.14 cm at 60 degrees latitude, and the bottom (south) side - from 55.66 cm at the equator to 27. 9 cm at a latitude of 60 degrees.
Card colors
The color design of topographic maps involves highlighting the corresponding objects in color:
- shrubs, forests and other green mass in the territories are indicated in green;
- the body of water and glaciers are colored turquoise;
- relief, various types of soil are colored orange;
- improved roads are highlighted in yellow;
- for settlements and cities with a population of more than 50 thousand, the color is orange;
- sands and rocky surfaces are highlighted in brown.
For other designations use black.
Concept and classification of conventional signs
A topographic map is a structured system of images for which conventional cartographic signs are of great importance. Experts divide them into signs of general use, as well as signs used to identify objects in the professional field.
For the convenience of using such signs, a special classification system has been introduced:
- Area . Designed to identify macro objects: meadows, lakes, rivers. With the help of area symbols, a cartographic image not only determines the location of an object, but also helps to imagine its real dimensions. Application rules provide for partial or complete shading of the body of the figure.
- Spot . These are objects of minimal size that cannot be fully displayed on the map due to scale: road signs, free-standing pillars, wells, monuments.
- Linear . Symbols that indicate roads, their length, and boundary lines of industrial structures.
Nautical charts.
These are special maps of seas and oceans. The most important and most common are navigational sea charts intended for driving ships. Their contents: bottom relief, depicted by isobaths and marks, soil characteristics, outline and characteristics of the coast, relief and prominent landmarks on the shore, sea routes, navigation hazards (shoals, reefs, rocks, breakers), navigational signs (lighthouses, directional signs) , information about magnetic declination, elements of hydrology (currents, tides, ice boundaries).
Nautical charts include private charts (scales 1:25,000-1:100,000), route charts (scales 1:100,000-1:500,000), general and overview (scales 1:500,000 and smaller). The content of marine navigation charts is supplemented and explained by directions.
Methods of cartographic representation
Conventional signs take into account the characteristics of objects, describing their quantity and quality.
Isolines
They are called level lines. These are lines connecting in pairs points of identical indicator values on the map. They are used to indicate temperature levels and pressure indicators.
The method using isolines is considered the most informative for measurements. The peculiarity of the image of isolines is the coloring of the spaces between them. It allows you to take into account the decrease and increase of a specific indicator.
Main types of isolines:
- indicator of average wind speed – isoanemon;
- indicators of tectonic movements of rocks - isobase;
- level of equal heights – isohypsum;
- level of rock layers – isopach;
- a line indicating the uniformity of precipitation - isohyet;
- depth level of reservoirs - isobath.
Mapping methods
Linear signs are used to describe objects that have a clear boundary.
Using color highlighting, the dynamics of changes in an object are indicated:
- High quality background . This is a color way of depicting an object. It is associated with the designation of the adjacent territory, and shading is used as a clarification.
- Oscillation diagram . A method that allows you to clarify changes in temperature, precipitation and air masses.
- Spot. It is used to designate crop areas and livestock numbers.
- Habitats . They are highlighted on the map by applying special colors, shading, icons, and symbols. It is allowed to use traffic signs that can show the direction of movement of the population, cyclones, birds, and electricity.
- Cartodiagram . Reflection of statistics for units of administrative-territorial division.
- Dynamic signs . This is one of the youngest methods of cartographic representation. It is used to enhance the animation effect.
Terrain imaging methods
Relief is one of the most important structures of the geographical envelope. Its image on topographic maps plays a significant role: it influences the position of accompanying elements.
Additional items and objects are placed in the relief pattern. The depiction of relief is associated with difficulties in reliably conveying its volume. Several methods are used to draw relief.
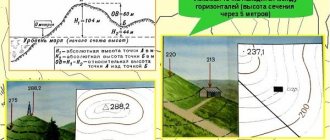
Horizontals
This method is used on large-scale topographic maps. The horizontal line is graphically represented by a line connecting equal height indicators. To graphically describe the relief with horizontal lines, the territory is dissected by several horizontal planes, which are located at a distant distance from each other.
Depending on the nature of the relief, the dissection ranges from 2 to 5 planes.
The section is taken as the height of the relief and is designated as h. Horizontal planes have no intersection points. Mountains, slopes, volumetric basins can be depicted as closed horizontal planes with the direction of the shading down or up.
Types of contours:
- solid;
- thickened;
- additional or semi-horizontal;
- auxiliary.
With marks
Marks highlight individual points on the ground; for this purpose, captions are used in a predetermined font.
Color and symbols
The washing method is used for small-scale maps . The method allows the use of color notations. The surface of the earth is predominantly painted brown, while water bodies are highlighted in turquoise.
The coloring is made more clear or blurred; these techniques make it possible to determine the depths and heights at the first glance at the signs. Conventional signs in the form of three-dimensional drawings of animals and plants are often used to provide a perspective representation of flora and fauna on children's maps.
Orientation using a map
Orientation is a way of determining location by objects that appear around you. The use of topographic maps for orientation is the task of people in many professions.
Orientation has 3 main tasks:
- Recognition of the area by basic features and calculation of location, recognition of the direction of movement in a specific area.
- Calculation of the sides of the horizon and one’s location, tactical determination of location for military-strategic purposes.
- Approximate calculation of the location and direction of movement, as well as calculation of the time to reach a certain point.
Orientation using a topographic map is considered one of the main ways to solve problems.
Determining geographic coordinates on a topographic map
Geographic coordinates are width and longitude; they facilitate calculations for the location of a specific object on the surface of the earth, based on a coordinate system. Topographic type maps are those maps that are covered with frame grids. The meridians are the east and west directions, and the north and south frames are parallels.
To calculate the geographic coordinates of a specified point, find a parallel and meridian located close to it.
The cartographic image grid is divided into minutes with a minimum of 10 seconds. The frames on the sides are taken as an indicator of the corresponding latitude, and the top and bottom sides are taken as longitude.
To calculate geographic coordinates, measure the distance from a specific point to the southern side of the frame, then apply an equal segment of a measuring compass on the other side and set the minutes in a specific time period. The minute indicators are added to the determined indicators of the southwestern corner of the grid, thus obtaining the latitude.
Longitude is also measured, while the indicators on the other side of the frame, which symbolizes the coordinate system, are measured. The method of calculating coordinates from topographic maps is often used for military-strategic purposes. Determining the location by width and longitude allows you to accurately determine the location of the object.
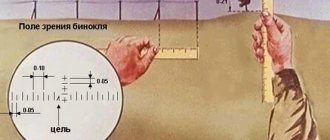
Measuring distances on a map
To calculate distances, maps with refinements of numerical and linear scales are used:
- Straight lines. A ruler is used for fixation. The indicator obtained as a result of the measurement is multiplied by the scale value of a particular map.
- To measure the values of indirect segments, a compass is used . The indicator is multiplied by the scale mark, taking into account a coefficient that allows fluctuations due to the nature of the terrain.
- Curved lines of a sinuous type . A curvimeter is suitable for measurement. This is a device that consists of a wheel connected to a dial along which a sensitive hand moves. As the wheel moves across the territory shown on the map, the arrow begins to oscillate to indicate the desired distance. It is expressed in centimeters. Before starting measurements, the curvimeter indicator is set to position “0”. The result is multiplied by a value corresponding to the map scale. The resulting value is the distance in the designated area that needed to be measured.
- Squares . The area of a specific object is calculated using the squares of the coordinate grid. Straight lines will show more accurate results than curved lines.
Specialist cartographers point out that measuring distances in mountainous areas is made difficult by the discrepancy in heights. To increase the accuracy of measurements, special coefficients are adopted that take into account the nature of the terrain and the scaling scale.
Relief characteristics
To characterize the relief depicted on a topographic map, use the available data:
- Absolute altitude is a segment from ocean level to a point on the earth's surface.
- Relative altitude is an indicator that reflects the difference between one point above sea level and another.
- The relief section is the difference between 2 adjacent heights.
The cross-section of the relief is determined by the map scale, and also depends on the type of relief. It is expressed as a numerical value in the map legend. To understand the characteristics of the terrain, it is necessary to take into account the presence of ascents and descents. In addition, the directions of river flow, which are indicated by black arrows on topographic maps, are important.
Taking into account the listed indicators, changes in the characteristics of the relief and the difference between relative heights in the proposed areas are identified using a topographic map.
Determining the steepness of the slope
The steepness of the slope is the angle of inclination. Using a cartographic image, in which the relief is depicted using the contour lines method, and is also combined with height indicators, you can find the steepness of the slope at given marks. The direction of the slope is graphically described by perpendicular horizontal lines and expresses its greatest steepness.
As a rule, tasks to identify the steepness of a slope are accompanied by indicating 2 points on the map. A connecting line is drawn between them. Its type depends on the type of horizontal. The line intersects adjacent parts at an angle of 90°, this determines the direction of the steepness.
The numerical value of the slope steepness is calculated according to the established depth scale. With minimal estimates of the location, the slope is depicted as flat. The pitch scale is a numerical expression indicating the slope using a degree measure.
To calculate it, measure the segment from one adjacent horizontal line to another in the same direction.
Then mark the same segment on the placement scale using a compass. The indicator on the scale that will be opposite the delayed segment is the steepness of the slope in degrees. Using a topographic map is a necessity when you need to study the relief in a proposed area or calculate the geographic coordinates of the location of a given object.
Topography is a science that is actively developing along with the improvement of computer technology. They help increase the accuracy of indicators and eliminate the error of the information provided.
Article design: Oleg Lozinsky