Methods of depicting the earth's surface, their differences from each other
Currently, we can find a large variety of different images of the earth's surface. Filming can be done not only on the land surface, but can also take place in the ocean, air and from space. To denote the entire set of images of the area, the concept of “geoimage” is used. It refers to any models of earthly objects presented in graphical form.
Let's look at the types of images of the earth's surface:
- A globe is a three-dimensional model of our planet, reduced many times. This image of the earth's surface reflects the actual size ratio and relative position of various geographical objects. Also by looking at the globe, we can understand the shape and size of the Earth.
What is the difference between a globe and planet Earth? The most important difference is the size - it is much smaller. Objects are shown using special symbols called symbols.
- Maps and plans are considered another way of depicting the earth's surface and are displayed on a plane.
The plan most often shows an image of a small section of the earth's surface on a plane. The map contains an image of a significant area of the earth's surface, always reduced in scale. Individual continents, oceans, countries and even the entire planet are represented here. However, in all cases, geographical objects are marked using symbols.
- A large number of maps on a specific topic are combined into a collection called an atlas. They may vary depending on different parameters; let’s get acquainted with them in the figure.
- Aerial photographs and satellite images are considered one of the ways to depict a terrain. Using photographs, a detailed, reduced-scale image of the earth's surface is obtained on a plane.
The similarity of all photographic images is that they display the earth's surface most often in color, but there are also differences. For example, if you take pictures from an airplane, you can get an image of all the irregularities of the earth's surface. This type of image is called aerial photography.
Aerial photograph of the area
With the help of satellites, visual photographs are taken from space depicting the earth's surface on a plane. In these images, everything depends on the altitude at which the satellite is located - the higher, the less detailed the image will be. Such images are called space photographs.
Space image of the Earth
We got acquainted with different ways of depicting the earth. What is the difference between all the presented images of the earth's surface? Let's present this material in a table.
Image of the earth's surface in ancient times
Already in ancient times, when traveling and discovering new lands, people sought to preserve the knowledge gained for posterity; they wrote up descriptions, and also made drawings and drawings of the places they visited.
The first geographical images of the area have been known since the 3rd-2nd centuries. BC e. These are rock paintings, drawings on bark, leather, wood, and bone. The peoples of the Pacific created their maps from shells and cuttings of palm leaves.
Maps have been known to people for a long time. Maps became widespread in the Roman Empire. They were used to organize military campaigns and in government.
In Europe, the flourishing of cartography began in the 15th century. - the period of the Great Geographical Discoveries. Maps have become more detailed and accurate.
What is a site plan and symbols
A drawing of a small area, drawn to scale, is called a plan. In order to figure out how to draw up a site plan, you need to become familiar with the concept of “scale”.
Scale is a value that shows how many times the actual distance is reduced. Scale is used when depicting the earth's surface.
The presence of scale is considered the main difference from a regular drawing. Also, the site is shown as if from above and using symbols. Below are the symbols for depicting objects. The color picture represents the appearance of the area, and the black and white picture is a symbol.
Conventional signs
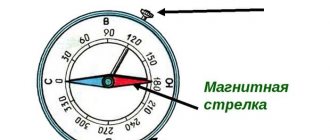
Knowing the designations, it is easy to understand what is located in a given place: a highway or a field road, a ravine or a river, a deciduous or mixed forest. The plan must indicate the sides of the horizon in the form of an arrow: N – northern, S – southern. This allows you to navigate, find the relative positions of objects on the sides of the horizon.
Often in life it is necessary to read a site plan or write a description of it. You can practice reading the plan using the figure below. Pay attention to the sides of the horizon and symbols.
Using this description, you can not only make an imaginary hike, but you can also independently draw up a plan of the area.
How to make a simple plan of any area if there is no description of it? In such cases, several methods are used. Their similarity is that you must be in the area where you will draw up the plan. Let's get acquainted with the basic shooting of the area.
- Visual photography can be mastered by anyone, since the distance between objects is determined by eye. To do this, you will need tools: a tablet, a sheet of paper, a compass, a pencil, an eraser. On paper we indicate the sides of the horizon, previously determined by the compass, and determine the scale. Objects that are within our visibility are drawn on the plan using conventional signs.
- Drawing up a site plan using the route survey method is the simplest. We need to choose the route we will take. In order to draw up a site plan using the route survey method, we walk along the route and mark objects encountered along the way. We mark them with symbols on the sheet, and be sure to indicate the sides of the horizon.
- Polar survey is considered another way of drawing up a site plan. To do this, select a point on the ground from which all objects are clearly visible. From this point or pole, a plan is drawn up. Mark the sides of the horizon on paper and determine the scale. Then they put a ruler and draw directions on objects, which are then measured in steps. The measured distances are marked on paper.
Drawing up a simple site plan based on description
Let's focus on drawing up a site plan based on the description. If there is a description of a route or a small area of terrain, then we can draw up a plan using symbols.
Let's look at the example of the movement of geologists:
We will step by step draw up an algorithm of actions for drawing up a drawing of a site plan.
- On paper you need to draw an arrow indicating the sides of the horizon. This is necessary for orientation according to the terrain plan.
- Let's choose the optimal scale and mark it on the terrain plan. In this case, a scale of 1 cm – 100 m is acceptable.
- Since geologists moved in a northern and northeastern direction, we will mark the starting point closer to the south. The beginning of the path is considered to be a spring, so let’s mark it with a symbol on the area plan.
- From the spring they moved 400 m in a north-east direction, which means we measure 4 cm using a ruler. They walked along a dirt road, we mark it with a symbol on the area plan.
- They reached a river that flowed from east to west. We mark the river and the direction of its flow on the plan. We mark a bridge across the river.
- They continued their journey along the road and after 600 m they saw a lake. Using a ruler, measure 6 cm to the north and draw a lake. Please note that the lake has certain dimensions.
- All along the road, a mixed forest grew to the left of them, and a coniferous forest to the right. Using symbols we indicate the area on the plan.
- From the lake we measure 5 cm to the northeast and mark a meadow on both sides of the path.
- Then they entered the coniferous forest and saw the forester's house.
As a result of the work done, we should get a geographical plan of the area with symbols, similar to the figure presented below.
What is the difference between a map and a site plan?
- The scale of the plan is larger, and the scale of the map is smaller.
- On a site plan and a geographical map, objects are depicted to scale, but this is not always the case on a map. For example, cities on the map are indicated by a circle, but on the city plan there are separate streets and houses.
- The direction on the plan is determined by a straight arrow, and on the map by the lines of the degree network.
Despite all these differences, they depict the earth's surface to scale using conventional symbols.
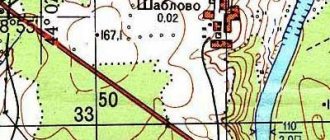
Site plan
Various objects are depicted on the terrain plan using symbols. There are also rules for coloring various objects. So, for example, forests and parks on plans are always painted over with green paint, ponds - blue, shrubs - pale green, gardens - yellow, mountains - brown. Buildings, regardless of their actual shape, are usually depicted as rectangles.
Plans, maps, and globes must certainly have a scale - an indicator of how many times the distance in the image is less than in reality. The scale is always a fraction in which the numerator is one, and the denominator is a number indicating the reduction factor. For example, a scale of 1 1000 or, as is more commonly depicted, 1: 1000 indicates that the distance in the image is reduced by 1000 times. Sometimes cartographers do without fractions and simply write “1 cm = 100 km.” When written as a fraction, it is called a “numerical scale,” while when expressed in words, it is called a “named scale.”
For convenience, a “linear scale” can also be used. A measuring ruler is depicted on a plan or map, with which, using a compass, you can measure any linear quantity without resorting to calculations. A numerical or named scale is indicated above the linear scale.
Note! The numerator of a fraction expressing a scale must always contain one! If one is in the denominator, it will appear as if the distance on the map or plan is several times greater than the real one. This is absurd
Plans and maps are always drawn zoomed out. There are three laws regarding scale.
The first law is that the scale must be on any map and on any plan. Geographers consider a map without a scale not a map, but a drawing.
The second law is that all distances in the image must correspond to the specified scale, otherwise it will again be a drawing.
Law three - the smaller the denominator, the larger the scale. For example, a scale of 1:1000 is larger than a scale of 1:50000.
The size of the scale is one of the features that distinguishes plans from maps. The scale on the plan cannot be smaller than 1: 5000.
Based on the scale, maps are divided into large-scale (1:10,000 – 1:200,000), medium-scale (1:200,000 – 1:1,000,000) and small-scale (smaller than 1:1,000,000).
Conventional signs are divided into:
- large-scale symbols, the image dimensions of which are determined by the scale of the map. Large-scale signs, in turn, are divided into areal (forest, lake) and linear (railroad). Linear signs are scaled only in length, their width is relative.
- off-scale or point symbols (well, spring);
- explanatory signs that are used in combination with scale and non-scale and serve to further characterize the depicted objects. For example, an arrow on a river indicates the direction of its flow.
Degree network
On the globe and all geographical maps there is a grid of thin lines, called the degree network. What is the concept and meaning of a degree network?
The Earth's degree network consists of conventional lines intersecting each other. These lines are extremely necessary for finding objects.
We are already familiar with two points - the North and South Pole. At an equal distance from the poles, a line of the degree network is drawn in the form of a circle - the equator. Lines running parallel to this circle are called parallels. They stretch from west to east. Circles are drawn through the poles, intersecting parallels, called meridians and constituting a degree network. The length of the meridians is determined from north to south.
Degree network on the globe
Knowing the direction of the length of the lines of the degree network, we can determine by the sides of the horizon where the area is located on the map.
The length of parallels along the degree network may vary. The length along the degree network of meridians is the same everywhere. As a result, the main line of the degree network is considered to be the prime or prime meridian. This main grid line extends across the London suburbs and is easy to find on the map. This meridian divides the planet into 2 hemispheres: Western and Eastern.
The most important lines of the degree network are depicted as a circle on the map. Therefore, the length of parallels and meridians along the degree network is measured in kilometers and degrees. To understand the principle of determining distance in degrees, let's figure out how the degree network works.
Take any circle and divide it into 360 parts.
We connect the division points to the center of the circle, as a result the circle will be divided into 360 angles. Each angle will be equal to 10. In the figure, each angle is equal to 100, if we were to draw through 10, they would merge with each other. The degree network on the map is indicated in the same way, after a certain number of degrees. Most often, lines are drawn through 100. The degree network is very clearly visible on the contour map.
Contour map
Degrees are counted along parallels from the equator, and along meridians from the prime or Greenwich meridian. On the degree network, the equator and prime meridian are designated 00.
Using the degree network of the map, you can determine the distance between objects in degrees and kilometers. Let's look at an example.
1) Let’s identify geographic coordinates: the longitude of the westernmost point on the parallel of 10° N will correspond to 15° W; the longitude of the easternmost point on the same parallel will be 52° east.
2) Let's calculate the length of the continent in degrees along 10°N latitude, to do this we find the sum of the resulting degrees 15° + 52° = 67°
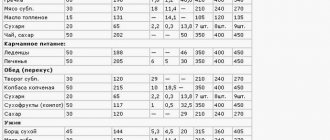
3) Determine the length in kilometers at 10° N latitude. We need to find out the length of the parallel. However, all parallels are different in length. You can use the table below to determine it.
In the table we find the length of parallel 100, it is 109.6 km. We multiply it by the identified degrees
109.6 km • 67 = 7014 km
We get the length of the continent from west to east in kilometers.
- Let's identify the geographic coordinates: the latitude of the northern point on this meridian will be 32° N, and the southern point will be 37° S.
- Let's calculate the extent in degrees along 20° East, for this we add the identified data 32° + 37° = 69°
- Let's find the length in kilometers at 20° East. To do this, multiply the length of 1° meridian by the degrees obtained
111.3 km • 69 = 7659 km
The value of 1° along the meridian always corresponds to 111.3 km, since all meridians are equal to each other.
Using the degree network, you can find the location of any area on the planet; they are called geographic coordinates.
Geographic map
Maps, unlike a terrain plan, depict larger areas of the planet or even its entirety.
A geographic map is a reduced image of the Earth's surface or its parts on a plane using a scale and symbols.
Maps vary in scale. The smaller the scale of the map, the less information (details) it can convey. However, no matter how detailed the map is, the area on it is still not depicted in as much detail as on the plan.
On geographical maps, blue color shows the expanse of water, light blue shows shallow bodies of water, and dark blue shows the depths of seas and oceans. Rivers are depicted as blue curved lines, lakes are depicted in the same way as on the site plan.
Green, yellow and orange indicate flat and hilly plains. Mountains are shown in different shades of brown.
The cards are also varied in content. Some maps show the relief of territories, seas, rivers (physical maps), others show countries of the world and their capitals (political maps), still others show enterprises, roads (economic maps), etc.
A degree network formed by intersecting lines is applied to the maps.
The lines connecting the North and South Poles are called meridians.
The prime meridian divides the globe into two hemispheres - Eastern and Western.
The lines with which the meridians intersect are called parallels.
The longest parallel is the equator. It divides the globe into the Northern and Southern Hemispheres.
Using a degree network, you can determine the position of any object on the planet.
- What can you learn from a site plan?
- What is scale needed for? What does it show?
- Why is a degree network needed?
A local plan and a geographical map are flat, reduced images of areas of the Earth's surface using symbols and scale. The scale shows how many times the distances on the plan or map are reduced in relation to real distances.
The horizon is the space visible to the eye. The imaginary line that limits the horizon is called the horizon line. There are main (north, south, west, east) and intermediate (northeast, southeast, southwest, northwest) sides of the horizon. The ability to determine one’s location relative to the sides of the horizon and individual objects is called orientation.
You can navigate the area using a compass, the sun, stars and local signs.
Geographic coordinates and their determination on the map
In 1960, a rocket was launched from the territory of the USSR, which flew a certain distance and landed in a given area. The geographic coordinates of this area are 100N latitude. and 1700W, knowing this, you can determine the landing site of the rocket. However, to determine coordinates, you need to become familiar with geographic latitude and longitude.
The latitude of all parts of the Earth is expressed in degrees, which count from the equator (00) to the poles (900). St. Petersburg is located at 600 north latitude (N), and Yakutsk is located at 640 N latitude. Therefore, in order to determine the geographic coordinates of a place on the map, you need to identify a parallel to its location.
On the map of the hemispheres in the atlas, parallels are drawn through 200. All points with geographic coordinates located north of the equator have northern latitude. The city of Cape Town has geographical coordinates lying south of the equator. In this case, the latitude will be southern (S) and can vary from 00 to 900. In this way, you can create an algorithm for determining latitude on the map.
To identify a place on a map, you need to know not only the geographic latitude, but also the longitude. For example, several cities may be located at the same latitude, but their geographic coordinates will be different.
Like latitude, longitude is expressed in degrees, which are measured from the prime meridian. The geographic coordinates of a place on the map located to the east of the meridian will have eastern longitude (E), and to the west - western longitude (W). Degrees of longitude on the globe and map are indicated at the equator.
Once you have the latitude and longitude, you can specify the full geographic coordinates. For example, St. Petersburg is located at 600N. and 300v.d. What are the geographic coordinates of the capital of Russia, Moscow? It can be found between 400N. and 600N latitude, more precisely latitude 550. Longitude is located between 400 and 300, approximately we will consider 380E. Then we get the coordinates of Moscow 550N. and 380v.d.
Having examined the various ways of depicting the surface of the globe, we can say that each of them is important not only for scientists, but also for ordinary people. Currently, they are used in many areas of human activity.