Determination of heights of points and elevations between them
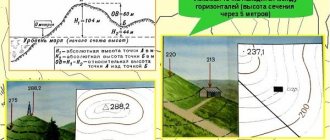
One of the most common tasks solved using a map (plan) is determining the elevations (heights) of terrain points. When solving this problem, you should be guided by the following rules (Fig. 7).
1. The elevation of a point located on the horizontal is equal to the elevation of this horizontal (for example, in Fig. 6 H1 = 152.5 m
).
Contour marks are found taking into account the height of the relief section, the direction of the slope, the signatures of the marks of thickened contours and characteristic points of the relief. It should be remembered that the contour marks are multiples of the height of the relief section.
2. The elevation of a point located between the horizontal lines (for example, point 2) is determined from the expression:
, (12)
where is Nml.
– the level of the minor horizontal line, (
Nml
= 150.0 m), – the excess of point 2 above the minor horizontal line;
d
– slope location,
l1
– distance in plan from the minor horizontal to the point;
h
– height of the relief section, m. The values of
d
and
l1
are determined on the plan using a measuring compass with an accuracy of 0.2 mm.
For the one shown in Fig. 6 examples
For control, the point elevation should be determined relative to the senior horizontal as
(13)
3. The elevation of a point located between horizontal lines with identical marks (point 3 - saddle) or inside a closed horizontal line (point 4 - top) can only be determined approximately. In this case, the elevation of the point is taken to be less or greater than the elevation of this horizontal line by half the height of the relief section, i.e. 0.5 h
. For example:
Excesses between points are defined as the difference between the marks of the next and previous marks, i.e.
. (14)
The calculation results are given in table. 12.
Table 12. Determination of point elevations and elevations
| Points | Point marks H , m | Exceedance h , m |
| 1 | 152,50 | |
| –1,50 | ||
| 2 | 151,00 | |
| +2,75 | ||
| 3 | 153,75 | |
| +7,50 | ||
| 4 | 161,25 | |
| –8,75 | ||
| 1 | 152,50 |
The control for the correctness of calculations is the equality of the sum of all excesses to zero, i.e. .
Calculation and construction of a deposit schedule
The steepness of the slope (angle of inclination of the slope) and the slope of the line i
between points lying on adjacent horizontal lines are determined by the formulas:
from here. (15)
To avoid calculations, when solving these problems using a map, location graphs are used, which are calculated and plotted according to the height of the relief section and the scale of the given plan (map). The construction of the laying schedule is carried out in the following order:
1. The horizontal line is divided into equal segments of arbitrary length; at the ends of the segments, the values of the inclination angles are signed, starting from 0°30′.
2. Calculate the positions corresponding to each value of the inclination angle at the accepted height of the relief section, according to the formula:
, m. (16)
The length of each segment is expressed on the plan (map) scale as
, cm,
where M
– denominator of the numerical scale of the plan.
The calculation results are entered in the table. 13.
Table 13. Calculation of elements of the deposit schedule
| d , m | , cm | ||
| 0°30′ | 114,60 | 286,5 | 2,86 |
| 1° | 57,29 | 143,2 | 1,43 |
| 2° | … | … | … |
| 3° | … | … | … |
| 4° | … | … | … |
| 5° | … | … | … |
| … | … | … | … |
3. The resulting values of the deposits are laid on the perpendiculars of the line against the corresponding angles of inclination. A smooth curve is drawn through the obtained points and a slope graph is obtained (Fig. 8). If at the dividing points of a horizontal line, instead of slope angles, slope values are written and the corresponding plots are plotted on the perpendiculars, then we have a slope graph. The laying schedule is drawn on a piece of graph paper and pasted into the workbook.
Download material
so UNT / Lesson developments / Lessons on geodesy
Methods for determining heights
27.04.2016 7867 674
Relief depiction on topographic maps
gives a complete and sufficiently detailed idea of the unevenness of the earth's surface, their shape and relative position, elevations and absolute heights of terrain points, the prevailing steepness and length of the slopes. On modern topographic maps, the relief is depicted by contour lines in combination with symbols of cliffs, rocks, ravines, gullies, screes, landslides, etc. The relief image is supplemented by captions of the absolute heights of characteristic points of the terrain, contour lines, sizes of individual relief forms and directional indicators of slopes.
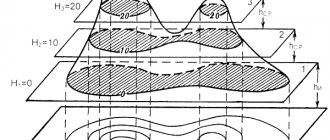
The essence of depicting relief with horizontal lines.
The horizontal line is a closed line depicting a horizontal contour of unevenness on the map, all points of which on the ground are located at the same height above sea level. Horizontal lines can be represented as lines obtained as a result of cutting the terrain with level surfaces, that is, surfaces parallel to the water level in the oceans.
Fig. 1 The essence of depicting relief with horizontal lines.
Let's consider the essence of depicting relief with horizontal lines. Figure 1 shows an island with peaks A and B and coastlines D, E, F. The closed curve def is a plan view of the coastline. Since the coastline is a cross-section of the island by the surface of the ocean, the image of this line on the map is a zero horizontal line, all points of which have a height equal to zero. Let us assume that the ocean level has risen to a height h, then a new section of the island is formed by an imaginary cutting plane h - h. By designing this section using plumb lines, we obtain on the map an image of the first horizontal line, all points of which have height h. In the same way, you can get on the map an image of other sections made at heights 2h, 3h, 4h, etc. As a result, the map will depict the island's relief with contour lines. In this case, the relief of the island is depicted by three horizontal lines, covering the entire island, and two horizontal lines, covering each of the peaks separately. Peak A is slightly higher than 4h, and peak B is slightly higher than 3h relative to ocean level. The slopes of hill A are steeper than the slopes of hill B, so in the first case the contour lines on the map are located closer to each other than in the second. It can be seen from the figure that the method of depicting the relief with horizontal lines allows you to correctly not only display the shapes of the relief, but also determine the heights of individual points of the earth's surface based on the height of the relief section and the steepness of the slopes.
Relief section height
is the difference in height of two adjacent cutting surfaces. On a map it is expressed by the difference in heights of two adjacent contour lines. Within the map sheet, the height of the relief section is, as a rule, constant. Figure 2 shows a vertical section (profile) of the slope.
Fig.2 Profile of the ramp.
Level surfaces are drawn through points M, N, O at a distance from each other equal to the height of section L. Intersecting the surface of the slope, they form curved lines, the orthogonal projections of which in the form of three horizontal lines are shown in the lower part of the figure. The distances mn and no between the horizontal lines are projections of the segments MN and NO of the slope. These projections are called contour lines.
Determination of point heights.
The absolute height of any point in the terrain, the mark of which is not marked on the map, is determined by the mark of the horizontal line closest to it.
Therefore, it is necessary to be able to determine the marks of contours using the marks of other contours and characteristic points of the area labeled on the map. For example, the horizontal mark a
(Fig. 3) can be determined by the height mark of 197.4 and the height of the relief section of 10 m.
Fig.3 Determining the horizontal elevation using the point elevation.
The horizontal elevation a is 190 m. Knowing the horizontal elevation a, you can easily determine the elevations of all other horizontals. So, horizontal b
will have an elevation of 160 m, since it is located below the horizontal
by
an amount equal to three heights of the relief section (30 m). In the case when a point is located between horizontal lines, find the height of the horizontal line closest to it and add to the resulting height the excess of this point above the horizontal, determined by eye. For example, the mill, the designation of which is located between the horizontal lines (Fig. 3), has an absolute height of 162 m.
Determination of mutual elevation of points
consists of establishing a value indicating how much one point is higher or lower than another. When points are located on the same horizontal line, their mutual excess is zero, since their heights are the same. If the identified points coincide with the points whose heights are marked on the map, their mutual elevation is equal to the difference of these heights. In the case when the points are located on the same slope or on different slopes close to each other, count the number of spaces between the horizontal lines and. their shares are added to the whole number, which are estimated by eye. The resulting number is multiplied by the height of the relief section and thus the mutual excess of the indicated points is obtained. When the points are located at a considerable distance from each other, their absolute heights are determined. The difference between these heights will be the mutual excess of the points.
Leveling
– this is a type of geodetic measurements, as a result of which the elevations of points (height difference) are determined, as well as their heights above the accepted level surface.
Based on the results of leveling, they depict the terrain on plans and maps, build profiles of the earth's surface, draw up organizational and economic plans for forest nurseries, design parks, and solve other problems of forestry and gardening. There are several types of leveling: geometric, trigonometric, barometric, hydrostatic, mechanical. Geometric leveling
is leveling with a horizontal line of sight.
This type of leveling is performed using a geodetic instrument - a level and slats. This method is the most common and relatively simple. It is used to determine elevations with a high degree of accuracy, when the error in determining elevations is no more than 1 mm per 1 km of distance. Trigonometric leveling
is leveling with an oblique sighting beam.
Performed using geodetic instruments that allow measuring vertical angles or elevations (theodolites, tacheometers, cypregels). With this type of leveling, the excess can be determined with an error of up to 4 cm per 100 m distance. Barometric leveling
- determining the heights of points or elevations by air pressure measurements.
Air pressure is measured using instruments called barometers, and the pressure difference is used to determine the excess. The accuracy of barometric leveling is low (ranges from 0.5 to 2 m) and depends on changes in weather conditions. This leveling method is used in the initial period of engineering surveys for all kinds of reconnaissance surveys. Hydrostatic leveling
is based on the property of liquid in communicating vessels to be at the same level.
The excess between points can be obtained as the difference in readings on the scales of vessels connected to each other by a hose. Hydrostatic leveling is used during construction and installation work to align structures in cramped conditions. Often used when observing deformations of engineering structures. Its accuracy is equal to the accuracy of geometric leveling. Mechanical leveling
is carried out using special devices installed on cars, bicycles, railway cars, etc. When the device moves, the terrain profile is immediately drawn on a special tape.
The accuracy of mechanical leveling is approximately equal to the accuracy of trigonometric leveling. This method is used in surveying linear structures and for monitoring the position of railway tracks. Stereophotogrammetric leveling
is implemented by processing stereo pairs of photographs of the same area, obtained both during ground-based phototheodolite photography and during aerial photography from aircraft.
When photographing on the ground, phototheodolites are used, which are a theodolite combined with a camera. For aerial photography, special aerial cameras are used, mounted on an aircraft on a gyro-stabilized platform, which allows the optical axis of the camera to be held in a vertical position, or close to a vertical position. Radar leveling
is used when leveling the earth's surface from an airplane or other aircraft (aerial radio leveling). The error in determining heights, depending on shooting conditions, reaches 2–5 m (up to 10 m). This type of leveling is used to construct a terrain profile and determine photographic heights during aerial photography. It is based on continuous measurement of the distance from an aircraft to the surface of the earth using an electromagnetic signal emitted by a transmitter and receiving it after reflection from the underlying surface. The time τ the signal spends on the double path s is recorded, i.e. a radio rangefinder is used. The main type of leveling is geometric, which is carried out using geodetic instruments - levels. Geometric leveling, according to technology and accuracy of work, is divided into classes I, II, III and IV and technical leveling. Leveling of classes I, II, III and IV constitutes the state leveling network, which is the high-altitude basis of topographic surveys of all scales and geodetic measurements carried out to meet the needs of economic activity and the defense of the country. The leveling network of classes I and II is the main high-rise basis, through which a unified system of heights is established throughout the territory of Ukraine. It is also intended for scientific purposes related to the study of oscillations of the earth's crust. Leveling networks of classes III and IV and technical leveling serve as the high-altitude basis for topographic surveys and are intended to solve various engineering problems (planning, development and improvement of populated areas; design and construction of roads, irrigation and drainage systems; water supply, sewerage, etc.)
See the downloadable file for the full text of the material.
The page contains only a fragment of the material.